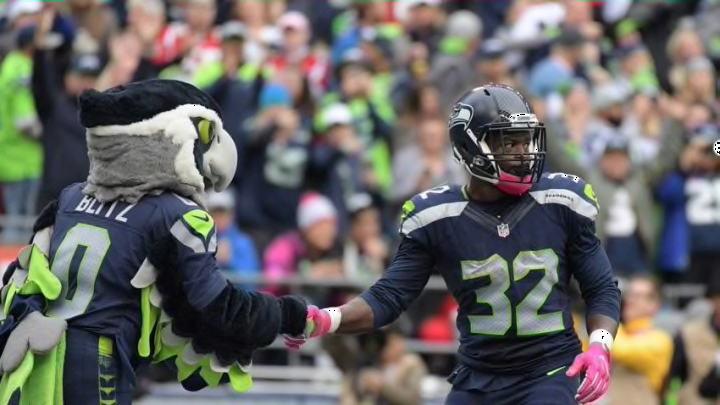
This week’s NFL Power Index has the Seattle Seahawks ranked at No. 2 as teams begin to settle in to more of where we’re expect them to be now that sample sizes are increasing.
The Seattle Seahawks climbed up three spots to No. 2 in this week’s NFL Power Index. While there is a blurring of the line that separates the tier 1 teams from tier 2, it is obvious that the Seahawks are one of the elite teams in the NFL.
More from 12th Man Rising
- 4 prospects Seahawks could reach for at No. 20 in 2023 NFL Draft
- Seattle Seahawks Mock Draft: Post-first wave of free agency
- Seahawks podcast: A review of the first week of free agency
- 4 experiments the Seattle Seahawks could cut short in 2023
- 3 pros and cons of Seattle Seahawks drafting Anthony Richardson
It should be noted that the NFLPI wasn’t updated last week due to the Seahawks being on their bye week. All shifts in the ranking are because of a two-week shift in each team’s stats.
Seattle up at No. 2 will likely make Seahawks fans happy. Being behind the team that Seattle just beat is bound to annoy a few readers. Try and keep in mind that this isn’t some subjective “power rankings,” though. Atlanta is No. 1 based on the stats they put up over all their games, not just last week.
The big risers this week are Buffalo and Arizona. Both got off to terrible starts on the season, but have been playing much better lately. The same is true for the Patriots, who have been much more dominant now that Tom Brady is back from his suspension.
Jets fans will have to be happy that the NFC West’s elite teams are no longer on their schedule. The last two weeks have been brutal losses at the hands of Seattle and Arizona. The result has them in the bottoms spot.
Interestingly, the Rams have lost two-straight games, but they haven’t moved in the NFLPI rankings. This metric suggested that the Rams were a mediocre team even when they were 3-1. They are now at 3-3, with roughly the same overall Power. In other words, their slide in the standing should come as no surprise.
Here are the complete rankings.
| Rank | Last | Team | Yds | Pt Dif | 3% | TO | Power |
| 1 | 3 | Atlanta | 2.5 | 5.5 | -1.7 | 1 | 76.51 |
| 2 | 5 | Seattle | 0.7 | 5.4 | 8.9 | 1 | 74.26 |
| 3 | 10 | Buffalo | 0.6 | 9.8 | 4.4 | 8 | 72.53 |
| 4 | 6 | Minnesota | 0.4 | 11.2 | 6.2 | 11 | 67.95 |
| 5 | 12 | New England | 1.5 | 9.6 | -2 | 4 | 67.18 |
| 6 | 13 | Arizona | 0.8 | 8.2 | 4.7 | 4 | 63.85 |
| 7 | 1 | Pittsburgh | 0.1 | 5.2 | 10 | -2 | 60.98 |
| 8 | 8 | Dallas | 1.2 | 8.7 | 1.5 | 4 | 60.01 |
| 9 | 2 | Denver | 0.4 | 5.3 | 1.1 | 3 | 59.53 |
| 10 | 7 | San Diego | 0.9 | 3.0 | 1.4 | -2 | 58.25 |
| 11 | 18 | Kansas City | -0.3 | 1.4 | -2 | 5 | 55.69 |
| 12 | 4 | Philadelphia | -0.2 | 11.4 | -4.4 | 6 | 55.26 |
| 13 | 9 | Green Bay | -0.5 | 0.2 | 15 | -3 | 55.04 |
| 14 | 21 | Tennessee | 0.7 | -1.2 | 6.1 | -3 | 51.51 |
| 15 | 11 | Baltimore | 0.1 | 0.3 | 1.1 | 3 | 50.00 |
| 16 | 28 | Miami | 0.8 | -2.6 | 0.4 | -5 | 47.92 |
| 17 | 29 | Washington | 0.1 | 0.0 | -5.1 | 0 | 47.65 |
| 18 | 25 | New Orleans | -0.9 | -2.6 | 5.5 | 2 | 47.25 |
| 19 | 19 | Indianapolis | -1.1 | -2.3 | 2.8 | 0 | 45.36 |
| 20 | 14 | Oakland | -1.4 | -1.9 | 0.9 | 5 | 43.30 |
| 21 | 22 | Detroit | -1.1 | -0.5 | -2.8 | -1 | 43.22 |
| 22 | 24 | Chicago | 0.5 | -7.0 | -3 | -1 | 43.03 |
| 23 | 17 | Houston | -0.7 | -3.2 | 2.7 | -4 | 41.85 |
| 24 | 23 | NY Giants | 1.1 | -2.5 | -6.8 | -10 | 41.12 |
| 25 | 15 | Carolina | 0.1 | -2.5 | -1.8 | -8 | 39.46 |
| 26 | 26 | Los Angeles | -0.3 | -4.5 | -6.6 | 0 | 37.96 |
| 27 | 32 | Jacksonville | 0.0 | -5.2 | -17.6 | -4 | 35.09 |
| 28 | 16 | Cincinnati | -0.6 | -6.0 | -6.5 | 2 | 32.93 |
| 29 | 20 | Cleveland | -0.3 | -10.5 | -8.8 | -1 | 29.92 |
| 30 | 31 | Tampa Bay | -2.1 | -9.6 | 8 | -5 | 22.21 |
| 31 | 30 | San Francisco | -1.7 | -9.6 | -8.1 | 0 | 13.36 |
| 32 | 27 | NY Jets | -1.4 | -11.5 | -1.8 | -12 | 9.78 |
Note that all stats used are per-play stats (yards per carry, yards per attempt against, etc.) for offense, defense and special teams. Points, turnovers, etc. are per-game stats to account for bye weeks. Strength of schedule is taken from TeamRankings.
