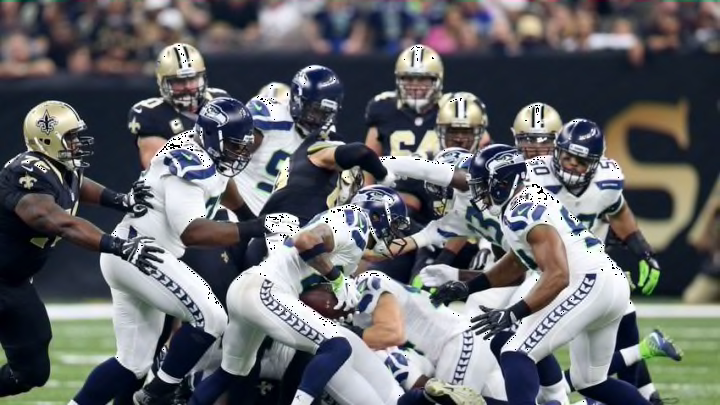
Despite their win over a good Bills team, the slide of the Seattle Seahawks in the NFL Power Index continued this week.
At this point in the season, the NFL Power Index for most teams begins to stabilize. Teams are who they are. That means we rarely see large shifts in the rankings at this point.
Of course there has to be one exception, right? The New Orleans Saints have suddenly come alive, and they’ve jump all the way to the 5th spot. That was a massively unexpected most for them.
The Seahawks slide continues, with them now dropping all the way to 16th. Their inability to run the football has limited how much their offensive metrics rebounded this week despite the win and 31 points scored.
Defensively, the Seahawks metrics continue to falter. The dominant defense that once has the Seahawks ranked as high as 2nd in the NFL Power Index, now suddenly cannot get off the field. There are only 3 teams with worse results on 3rd down than Seattle.
On the other hand, the NFL Power Index says that the Seahawks just beat a team that is better than you might think. The Bills have played better than their record, and their 12-of-17 on third downs against Seattle explains a lot about the direct the teams moved this week.
The Seahawks are currently in a very tough stretch in their schedule. After this week, they will have played the teams that are currently 1-5 in the rankings. Unfortunately, their games against the 49ers and Jets are prohibiting them from getting a strength-of-schedule boost right now.
Here are the full NFL Power Index rankings for Week 10:
| Rank | Last | Team | Yds | ST | 3% | SoS | Power |
| 1 | 1 | New England | 1.4 | 16.8 | 6.65 | 1.1 | 82.60 |
| 2 | 2 | Atlanta | 2.1 | 12.5 | -3.42 | 1.2 | 71.07 |
| 3 | 4 | Buffalo | 0.0 | 19.7 | 1.95 | 2 | 67.57 |
| 4 | 3 | Arizona | 0.9 | 15.4 | 6.07 | 0 | 65.56 |
| 5 | 18 | New Orleans | -0.7 | 18.5 | 14.1 | 0.8 | 62.11 |
| 6 | 9 | San Diego | 0.7 | 20.9 | 3.24 | 0.9 | 62.03 |
| 7 | 7 | Dallas | 1.5 | 17.7 | 5.41 | -2.2 | 59.75 |
| 8 | 6 | Denver | 0.6 | 14.7 | -2.31 | 0 | 58.89 |
| 9 | 5 | Minnesota | -0.4 | 22.8 | 0.47 | -0.8 | 58.72 |
| 10 | 13 | Oakland | -0.6 | 12.6 | 4.37 | 0 | 58.08 |
| 11 | 11 | Green Bay | 0.1 | 27.0 | 12.8 | -1.4 | 56.50 |
| 12 | 8 | Kansas City | -0.6 | 24.3 | -7.2 | -0.3 | 56.35 |
| 13 | 10 | Philadelphia | -0.2 | 13.9 | -4.68 | -0.4 | 56.25 |
| 14 | 12 | Seattle | 0.5 | 16.2 | -6.14 | 0 | 53.43 |
| 15 | 14 | Pittsburgh | -0.5 | 17.8 | 4.12 | 1 | 52.61 |
| 16 | 15 | Miami | 0.7 | 16.4 | 4.35 | -0.3 | 52.54 |
| 17 | 17 | Tennessee | 0.7 | 18.3 | 8.43 | -2 | 50.66 |
| 18 | 16 | Washington | 0.1 | 27.4 | -1.26 | -0.9 | 50.52 |
| 19 | 20 | Baltimore | -0.3 | 15.9 | -1.26 | -1.4 | 48.29 |
| 20 | 19 | Cincinnati | 0.1 | 21.9 | -3.7 | 0.9 | 48.22 |
| 21 | 23 | Carolina | 0.2 | 9.1 | 1.29 | 0.1 | 46.05 |
| 22 | 21 | Chicago | 1.0 | 12.0 | -1.59 | -0.3 | 45.81 |
| 23 | 22 | Detroit | -0.6 | 17.2 | -4.89 | -0.9 | 44.96 |
| 24 | 24 | NY Giants | 0.3 | 13.5 | -6.26 | -0.3 | 42.04 |
| 25 | 25 | Indianapolis | -1.1 | 19.1 | -0.72 | -0.5 | 41.95 |
| 26 | 28 | Houston | -1.0 | 13.5 | 4.7 | -0.2 | 39.26 |
| 27 | 26 | Los Angeles | -0.2 | 20.1 | -3.86 | 0.4 | 39.15 |
| 29 | 27 | Tampa Bay | -1.5 | 21.4 | 4.37 | 0.6 | 35.83 |
| 28 | 30 | NY Jets | 0.1 | 23.1 | -1.15 | 2 | 31.88 |
| 30 | 29 | Jacksonville | 0.3 | 16.6 | -10.78 | 0 | 28.02 |
| 31 | 31 | Cleveland | -1.2 | 19.4 | -11 | 0.2 | 21.18 |
| 32 | 32 | San Francisco | -1.8 | 16.2 | -11.47 | 0 | 16.74 |
Next: Seahawks get all the calls... umm... about that...
Listed are a few of the composite metrics that are combined non-linearly into the Power metric. All offensive and defense stats are compiled on a per-play basis to account for varying tempos. strength of schedule is provided by TeamRankings.
