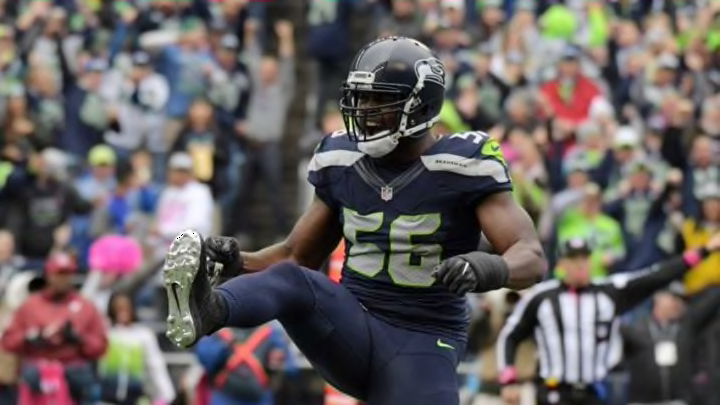
After dropping all the way to 14th, the Seattle Seahawks have surged up to 4th in The NFL Power Index over the last two weeks.
Remember when the Seahawks were struggling on offense and the defense looked ragged after being on field forever? It seems like such a long time ago now. For the last two weeks, it has been like a completely new offense for the Seahawks. The NFL Power Index has started to notice the improvement.
After bottoming out at 14th after the Buffalo game, the Seahawks have jumped all the way back to 4th. They’ve improved in almost every single metric over that time, and they’ve made massive strides in 3rd down efficiency on both sides of the ball.
With only 6 games remaining, it will be difficult for Seattle to catch New England for top spot. A 12 point deficit is a huge difference to overcome even with Seattle’s improved play. Plus, their defensive metric are likely to take a step back this week with Earl Thomas out.
The other end of the spectrum is a tale of two terrible football teams. Both the 49ers and Browns are historically bad. Any team with an NFL Power Index under 20 is rare. to have 2 such teams is unheard of.
Here are the full NFL Power Index rankings and a few of the input indices that are used to create it:
| Rank | Last | Team | Yds | Pt Dif | 3% | SoS | TO | Power |
| 1 | 1 | New England | 1.3 | 9.1 | 7.6 | 0.8 | 1 | 76.90 |
| 2 | 3 | Buffalo | 0.3 | 3.8 | -1.23 | 2.2 | 8 | 69.05 |
| 3 | 2 | Atlanta | 1.8 | 3.7 | -4.74 | 1.6 | 3 | 68.19 |
| 4 | 9 | Seattle | 0.9 | 4.6 | -5.85 | 1.4 | 6 | 64.33 |
| 5 | 4 | Dallas | 1.3 | 9.8 | 8.04 | -1.6 | 3 | 63.59 |
| 6 | 6 | Arizona | 0.9 | 3.6 | 4.25 | -0.2 | -1 | 60.75 |
| 7 | 7 | Denver | 0.1 | 5.0 | 0.49 | 0.3 | 5 | 60.27 |
| 8 | 5 | New Orleans | 0.2 | -0.1 | 8.3 | 1.2 | 0 | 59.50 |
| 9 | 13 | Minnesota | -0.6 | 2.9 | 1.36 | -0.6 | 13 | 59.40 |
| 10 | 8 | Oakland | -0.4 | 2.9 | 2.11 | 0 | 10 | 59.03 |
| 11 | 12 | Miami | 0.9 | 0.2 | 1.79 | 0.4 | 0 | 57.58 |
| 12 | 14 | San Diego | 0.4 | 1.4 | 4.22 | 0.5 | -3 | 56.45 |
| 13 | 16 | Washington | 0.6 | 2.1 | 1.32 | -1 | 2 | 55.64 |
| 14 | 19 | Pittsburgh | -0.3 | 2.3 | 3.59 | 0.4 | 2 | 55.18 |
| 15 | 10 | Philadelphia | -0.6 | 5.5 | -1.62 | 0.4 | 4 | 54.92 |
| 16 | 15 | Tennessee | 0.9 | 0.5 | 8.64 | -1.7 | -2 | 54.41 |
| 17 | 11 | Kansas City | -0.5 | 3.5 | -11.06 | -0.4 | 13 | 53.30 |
| 18 | 17 | Baltimore | 0.0 | 1.2 | -0.26 | -1.6 | 3 | 50.85 |
| 19 | 22 | Tampa Bay | -1.3 | -2.4 | 9.62 | 0.3 | 1 | 48.29 |
| 20 | 21 | Carolina | 0.0 | -0.2 | 4.49 | -0.1 | -5 | 47.87 |
| 21 | 20 | Cincinnati | -0.2 | -2.7 | -2.16 | 1 | 2 | 47.52 |
| 22 | 23 | Detroit | -0.6 | 0.6 | -3.65 | -1.7 | 2 | 47.04 |
| 23 | 24 | NY Giants | 0.2 | 0.4 | -3.03 | -1.2 | -7 | 45.63 |
| 24 | 18 | Green Bay | -0.7 | -2.9 | 5.45 | -1.2 | -6 | 45.15 |
| 25 | 25 | Indianapolis | -0.9 | -1.0 | 0.04 | -1.5 | -3 | 44.26 |
| 26 | 27 | Los Angeles | -0.4 | -3.8 | -2.84 | 0.3 | -3 | 40.92 |
| 27 | 26 | Houston | -0.8 | -3.4 | 3.36 | -0.3 | -6 | 40.40 |
| 28 | 28 | Chicago | 1.0 | -8.0 | -5.08 | -0.3 | -6 | 39.89 |
| 29 | 29 | NY Jets | 0.2 | -6.5 | -1.03 | 1.3 | -11 | 34.00 |
| 30 | 30 | Jacksonville | 0.0 | -7.2 | -7.41 | -0.6 | -15 | 29.40 |
| 31 | 32 | San Francisco | -1.8 | -10.9 | -11.38 | 1 | -3 | 13.11 |
| 32 | 31 | Cleveland | -1.4 | -12.8 | -13.63 | 0.7 | -7 | 11.10 |
Next: George Farmer called up, but for which position?
All stats were taken before the games on Thanksgiving Day. The Strength of Schedule metic is provided by TeamRankings.
