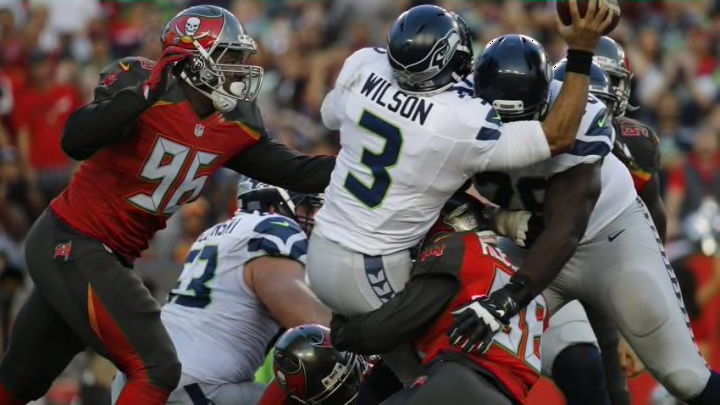
The NFL Power Index for Week 13 has the Seattle Seahawks dropping all the way to 10th after their terrible offensive performance against Tampa Bay.
After two weeks of significant advances by the Seattle Seahawks offense, they put force arguably their worst offensive performance of the year last week. The result was a massive drop in their offensive metrics and subsequent drop to 10th in the NFL Power Index.
It should also be noted that Tampa isn’t a good team. They were ranked 19th when the Seahawks laid that egg. Not only did Seattle play terribly, but their strength of schedule dropped as well.
The Seahawks weren’t the only big mover this week even though late-season shifts in the NFL Power Index are rare. New Orleans jumped up five spots, and Arizona slid down that same amount.
The biggest mover though was Pittsburgh. They seem to have put their mid-season struggles behind them and returned to being the dominant team from early in the season. The NFL Power Index is starting to reflect that with Steelers jumping from 14th to 7th this week.
There are a few oddball ranking this year. Buffalo holding onto a top 5 spot and San Diego at 8th are probably most notable. Both a teams that have played better than their records suggest. Both are also flawed teams that happen to be flawed in ways this metric doesn’t capture all that well. This offseason I’ll look to make some adjustments to this model to account for the new data.
Here are the full NFL Power Index rankings for Week 13:
| Rank | Last | Team | Yds | Pt Dif | 3% | SoS | Power |
| 1 | 1 | New England | 1.0 | 8.7 | 5.36 | 0.5 | 72.92 |
| 2 | 3 | Atlanta | 1.7 | 5.0 | -3.78 | 1.7 | 70.87 |
| 3 | 8 | New Orleans | 0.6 | 2.5 | 9.56 | 0.8 | 66.84 |
| 4 | 2 | Buffalo | 0.5 | 4.0 | -2.39 | 1.1 | 65.15 |
| 5 | 7 | Denver | 0.5 | 4.3 | 2.28 | 0.6 | 64.33 |
| 6 | 5 | Dallas | 1.3 | 9.3 | 6.62 | -1.8 | 61.30 |
| 7 | 14 | Pittsburgh | 0.0 | 4.0 | 3.78 | 0.4 | 61.15 |
| 8 | 12 | San Diego | 0.4 | 2.0 | 3.88 | 0.7 | 59.78 |
| 9 | 10 | Oakland | -0.6 | 2.9 | 4.12 | 0.2 | 59.62 |
| 10 | 4 | Seattle | 0.8 | 3.4 | -7.64 | 1.3 | 58.73 |
| 11 | 6 | Arizona | 0.8 | 1.6 | 3.45 | 0.1 | 58.50 |
| 12 | 9 | Minnesota | -0.6 | 2.3 | -0.37 | -0.5 | 57.92 |
| 13 | 13 | Washington | 0.5 | 1.5 | 1.71 | -0.3 | 56.21 |
| 14 | 11 | Miami | 0.7 | 0.8 | 1.59 | -0.6 | 55.96 |
| 15 | 16 | Tennessee | 1.1 | 1.0 | 6.97 | -1.9 | 54.78 |
| 16 | 17 | Kansas City | -0.9 | 3.4 | -11.55 | 0.5 | 53.54 |
| 17 | 19 | Tampa Bay | -1.1 | -1.4 | 11.16 | 0.5 | 52.67 |
| 18 | 18 | Baltimore | 0.1 | 1.5 | -0.22 | -1.6 | 51.63 |
| 19 | 15 | Philadelphia | -0.5 | 3.7 | -4.37 | 0.3 | 50.24 |
| 20 | 22 | Detroit | -0.6 | 0.9 | -1.74 | -1.9 | 48.31 |
| 21 | 23 | NY Giants | 0.3 | 1.6 | -2.06 | -1.7 | 48.22 |
| 22 | 20 | Carolina | 0.3 | -0.4 | 2.04 | 0.5 | 48.00 |
| 23 | 24 | Green Bay | -0.7 | -1.4 | 7.4 | -0.7 | 47.73 |
| 24 | 21 | Cincinnati | -0.2 | -2.9 | -1.91 | 1.2 | 46.14 |
| 25 | 25 | Indianapolis | -1.2 | -2.9 | -0.61 | -1.1 | 40.16 |
| 26 | 28 | Chicago | 0.6 | -7.8 | -3.11 | -0.9 | 39.39 |
| 27 | 27 | Houston | -0.8 | -3.9 | 3.13 | -0.5 | 38.40 |
| 28 | 29 | NY Jets | 0.3 | -6.4 | 0.6 | 1.3 | 34.39 |
| 29 | 26 | Los Angeles | -0.9 | -6.0 | -4.58 | 0.5 | 33.05 |
| 30 | 30 | Jacksonville | -0.1 | -7.1 | -5.49 | 0 | 26.85 |
| 31 | 31 | San Francisco | -1.6 | -10.6 | -10.32 | 0.8 | 15.75 |
| 32 | 32 | Cleveland | -1.4 | -12.9 | -13.32 | 0.3 | 12.85 |
Next: Panthers O-line in worse shape than Seattle's
Strength of Schedule is provided by Team Rankings. All other stats come from the NFL’s GSIS database. Over 30 stats are used, boiled down into indexes for various aspects of the game, and combined in a non-linear manner to create the NFL Power Index.
