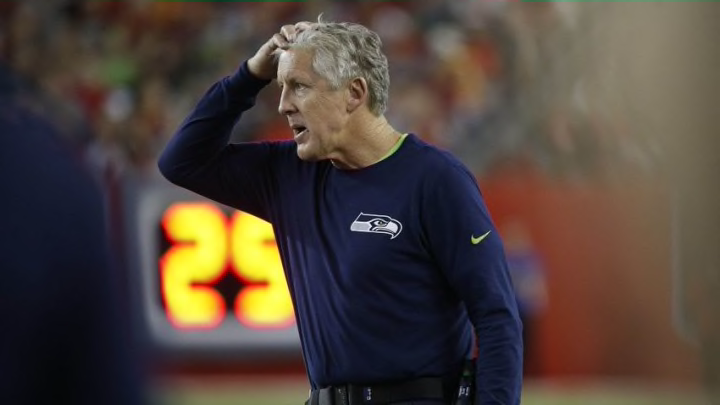
Despite their loss, the Seahawks maintained their top-10 spot in the NFL Power Index. Atlanta sits in the top spot, and Cleveland avoids making history.
The NFL Power Index decided to give the Seahawks a pass after their loss to the Arizona Cardinals last week. The maintained their 9th overall ranking. With only a game against the the dreadfully-bad 49ers left this season, a top-10 ranking is almost guaranteed.
Atlanta is going to have to crash and burn this week against the Saints to not finish as the NFL’s top team. Of course, them crashing and burning is good for Seattle’s hopes of getting a 1st round bye. Not many of us will be sad to see that happen, even if it does mean the Patriots grabbing that top spot.
On the other end of the spectrum, the Cleveland Browns picked a great time to win their first game in over a calendar year. They played well, and have (for now) moved up enough to avoid history. The NFLPI has never seen a team finish the year in the single digits in total power, and Cleveland has move outside of that range with one week to go.
Here are the full NFL Power Index rankings for Week 17:
| Rank | Last | Team | Yds | Pt Dif | 3% | SoS | Power |
| 1 | 1 | Atlanta | 1.9 | 8.6 | -0.3 | 0.9 | 82.03 |
| 2 | 2 | New England | 1.1 | 11.4 | 9.55 | -0.9 | 73.69 |
| 3 | 4 | Dallas | 1.7 | 8.6 | 3.57 | -0.9 | 69.16 |
| 4 | 3 | Pittsburgh | 0.7 | 4.6 | 2.35 | 1.1 | 65.93 |
| 5 | 6 | Oakland | -0.7 | 3.2 | -0.76 | 0.9 | 64.67 |
| 6 | 12 | Kansas City | 0.0 | 4.6 | -7.55 | 0.6 | 64.12 |
| 7 | 5 | Buffalo | 0.4 | 2.7 | 0.61 | -0.1 | 61.79 |
| 8 | 10 | Green Bay | -0.2 | 2.4 | 5.01 | -0.4 | 59.23 |
| 9 | 9 | Seattle | 0.9 | 4.0 | -0.83 | -0.3 | 57.36 |
| 10 | 13 | Baltimore | 0.0 | 2.6 | 0.02 | -0.2 | 57.28 |
| 11 | 20 | Washington | 0.7 | 1.4 | -1.65 | 0.5 | 57.04 |
| 12 | 11 | New Orleans | 0.4 | 1.4 | 6.4 | 0.2 | 56.90 |
| 13 | 8 | Tennessee | 0.7 | -0.3 | 7.1 | -0.8 | 56.01 |
| 14 | 14 | Arizona | 0.7 | 1.2 | 1.01 | -0.3 | 55.13 |
| 15 | 16 | Miami | 0.5 | 0.3 | 0.4 | -0.8 | 54.67 |
| 16 | 19 | Cincinnati | 0.0 | -0.4 | 1.29 | 0.5 | 52.52 |
| 17 | 7 | Denver | 0.2 | 1.2 | -3.02 | 1.5 | 52.19 |
| 18 | 15 | San Diego | 0.3 | -0.2 | 4.89 | 0.4 | 51.69 |
| 19 | 18 | Tampa Bay | -1.2 | -1.0 | 9.55 | 1 | 51.06 |
| 20 | 17 | Minnesota | -0.6 | -0.5 | -2.28 | -0.1 | 50.93 |
| 21 | 22 | NY Giants | 0.0 | 1.1 | 0.24 | -0.5 | 48.53 |
| 22 | 25 | Philadelphia | -1.0 | 1.5 | -2.28 | 0.9 | 47.92 |
| 23 | 23 | Indianapolis | -0.6 | 1.0 | 1.81 | -0.6 | 46.32 |
| 24 | 24 | Detroit | -0.8 | -0.3 | -2.24 | -1 | 45.21 |
| 25 | 21 | Carolina | -0.3 | -2.2 | -0.21 | 0.7 | 44.54 |
| 26 | 26 | Houston | -0.5 | -2.8 | 1.66 | -0.3 | 41.55 |
| 27 | 27 | Chicago | 0.4 | -6.2 | -1.26 | -1.2 | 37.36 |
| 28 | 29 | Jacksonville | -0.1 | -5.2 | -2.1 | -0.1 | 31.97 |
| 29 | 30 | Los Angeles | -1.1 | -8.8 | -5.2 | -0.1 | 26.46 |
| 30 | 31 | San Francisco | -1.6 | -11.2 | -10.24 | -0.2 | 22.93 |
| 31 | 28 | NY Jets | -0.3 | -10.3 | -3.66 | 0.2 | 18.54 |
| 32 | 32 | Cleveland | -1.3 | -12.3 | -11.85 | 0.4 | 13.64 |
This will be the 2nd-to last edition of the NFL Power Index in its current form. The final 2016 ranking will be released next week, and the the entire metric will see major overhaul, though Team Rankings will still likely provide the strength of schedule index.
The NFL Power Index was constructed 6 years ago using date from the previous decade. The NFL has evolved very quickly since then. Certain variables, like success running the ball, no longer correlate highly to winning. Others, like net third down efficiency correlate much higher than it used to.
Next: Tom Cable has failed the Seahawks
Each near, variable weights have been adjusted to accommodate the new data, but there is a limit to how much that can be done without completely destroying the predictive nature of the model.
Stay tuned for a completely new NFL Power Index to be unveiled sometime after the NFL Draft.
