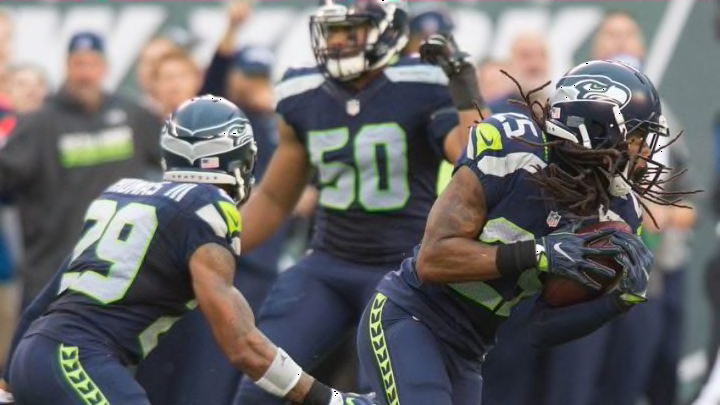
The results from the first edition of the NFL Power Index has the Seattle Seahawks among the top tier of NFL teams after four games.
The 2016 NFL season is now a quarter of the way complete. That means we finally have enough of a sample to unveil the first set of NFL Power Index rankings. As you might expect, this mathematical model is a big fan of the Seahawks again this season.
Seattle comes in as the 5th team in a very clear 6-team top tier. That is probably about right where they belong when you consider how bad the offense looked in the first 2 weeks of the season. They should climb within that group over the coming weeks now that the offense have found their footing.
The NFL Power Index is certainly not a fan of the LA Rams. Despite their 3-1 record, the Rams are 24th overall. They are below average in every category except for turnovers, and their fumble luck is unsustainable. Their current Power corresponds historically to 6.8 wins in season.
Topping the rankings currently are the Falcons. Their easy schedule has helped contribute to their quick start. With games against Denver and Seattle the next two weeks, we’re going to learn if they are for real or not.
Here are the full rankings, as well as a sampling of the indexes that go into calculating the Power Index values:
| Rank | Team | Yds | ST | Pt Dif | 3% | TO | Power |
| 1 | Atlanta | 2.8 | 18.6 | 7.0 | 0.7 | 3 | 81.86 |
| 2 | Pittsburgh | 0.8 | 18.3 | 7.0 | 13.3 | 1 | 77.08 |
| 3 | Denver | 1.5 | 16.8 | 11.8 | -2.6 | 3 | 76.20 |
| 4 | Philadelphia | -0.1 | -10.7 | 21.7 | -2.3 | 6 | 75.53 |
| 5 | Seattle | 1.3 | 18.5 | 6.3 | 9.2 | -1 | 74.45 |
| 6 | Minnesota | -0.2 | 27.4 | 9.5 | -2.5 | 10 | 71.17 |
| 7 | Green Bay | 0.3 | 22.6 | 2.7 | 11.4 | 0 | 67.24 |
| 8 | San Diego | 0.5 | 20.9 | 3.3 | 7.7 | 1 | 66.49 |
| 9 | Dallas | 0.1 | 12.4 | 6.0 | 6.5 | 3 | 66.04 |
| 10 | Buffalo | 0.0 | 19.3 | 4.8 | -3.1 | 6 | 60.61 |
| 11 | New England | 0.8 | 14.3 | 5.0 | -6.9 | 3 | 58.90 |
| 12 | Baltimore | 0.2 | 11.1 | 3.0 | 3.6 | -1 | 57.11 |
| 13 | Arizona | 0.7 | 8.4 | 3.0 | -2 | -1 | 54.53 |
| 14 | Houston | -0.5 | 15.5 | -1.0 | 11.4 | -3 | 52.98 |
| 15 | Oakland | -0.9 | 6.3 | 0.5 | 3.4 | 4 | 49.89 |
| 16 | Cincinnati | 0.4 | 23.9 | -1.0 | -8.7 | 1 | 47.70 |
| 17 | Carolina | -0.3 | 8.2 | -2.2 | 6 | -3 | 46.31 |
| 18 | Kansas City | -0.7 | 26.6 | -2.2 | -5.3 | 3 | 43.91 |
| 19 | Indianapolis | -1.1 | 20.0 | -4.3 | 5.9 | -1 | 43.20 |
| 20 | Cleveland | 0.9 | 19.8 | -10.3 | -0.6 | -1 | 43.05 |
| 21 | NY Giants | 1.5 | 8.8 | -3.0 | -6.1 | -8 | 42.87 |
| 22 | Tennessee | 0.2 | 18.6 | -5.5 | -0.3 | -4 | 41.71 |
| 23 | Detroit | -0.9 | 14.5 | -1.7 | 0 | -3 | 40.01 |
| 24 | Los Angeles | -0.5 | 16.9 | -3.2 | -10.8 | 4 | 38.45 |
| 25 | Miami | 0.4 | 14.3 | -4.5 | -5 | -5 | 38.41 |
| 26 | New Orleans | -1.5 | 14.5 | -4.0 | 1.5 | 1 | 37.54 |
| 27 | NY Jets | -1.5 | 17.2 | -6.5 | 13.3 | -11 | 34.27 |
| 28 | Chicago | 0.7 | 5.7 | -8.8 | -8.8 | -2 | 32.74 |
| 29 | Washington | -0.5 | 12.9 | -3.2 | -16.1 | 3 | 31.86 |
| 30 | San Francisco | -1.8 | 9.6 | -4.3 | -3.1 | 2 | 31.61 |
| 31 | Jacksonville | -0.1 | 23.6 | -6.8 | -17.3 | -2 | 27.45 |
| 32 | Tampa Bay | -1.5 | 20.8 | -12.7 | 4.9 | -9 | 21.80 |
Key:
- Yds – Yards index. Weighted combination of yards per pass lanyards per carry, for both offense and defense
- ST – Special teams index
- Ptdif – Point differential per game
- 3% – Net third down conversion rate (off-def)
- TO – Turnover differential
Note: Strength of schedule is not included until after Week 6.
Next: On Tyler Lockett and resilience
It should also be noted that wins and losses are not included in this model. Instead the model is meant to include the things that teams do that create wins. In that way, the NFL Power Index tends to predict how well teams will do in in their upcoming games.
