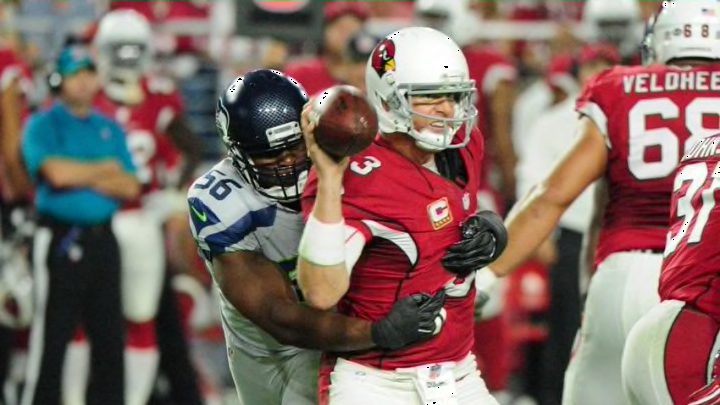
The NFL Power Index rankings for Week 8. The Seattle Seahawks, fresh off one of the worst offensive performances in decades, drops 6 spots to 8th overall.
It isn’t much of a surprise to see the Seattle Seahawks fall from No. 2 to No. 8 in the NFL Power Index metric. The offense was so bad this week that they lost ground in every single offensive metric. As dominant as Seattle’s defense was, that performance was on par with what we’ve seen the rest of the season, so those stats didn’t change.
The net result was a major drop in the overall power metric. They now sit under 60, which suggests they are a borderline wild-card team. Given how bad the offense has looked vs Arizona, LA and Miami, that isn’t all that surprising.
There is a new team at the top of the rankings, and it shouldn’t come as much of a surprise as to who it is. With Brady back, The Patriots been absolutely dominant, while other top teams have faltered of late.
Arizona, which was ranked 16th a month ago, has been surging recently. They’re now 5th, and the top team in the NFC West. It seems that the rumors of their demise after their slow start were premature.
Here are the complete NFL Power Index rankings:
| Rank | Last | Team | Yds | ST | Pt Dif | TO | Power |
| 1 | 5 | New England | 1.7 | 14.4 | 9.8 | 3 | 76.67 |
| 2 | 1 | Atlanta | 2.4 | 16.0 | 4.3 | 2 | 73.18 |
| 3 | 4 | Minnesota | 0.2 | 24.9 | 7.5 | 11 | 71.19 |
| 4 | 3 | Buffalo | 0.1 | 18.4 | 8.0 | 8 | 69.95 |
| 5 | 6 | Arizona | 0.9 | 14.9 | 7.0 | 4 | 67.63 |
| 6 | 9 | Denver | 0.8 | 13.2 | 7.2 | 5 | 62.43 |
| 7 | 8 | Dallas | 1.2 | 15.4 | 8.7 | 4 | 59.47 |
| 8 | 2 | Seattle | 0.3 | 21.7 | 4.5 | 1 | 58.49 |
| 9 | 10 | San Diego | 0.6 | 19.3 | 3.0 | -3 | 58.49 |
| 10 | 12 | Philadelphia | 0.0 | 16.0 | 11.3 | 6 | 56.02 |
| 11 | 7 | Pittsburgh | -0.3 | 15.3 | 2.9 | -1 | 55.06 |
| 12 | 13 | Green Bay | -0.3 | 23.0 | 2.8 | -2 | 54.46 |
| 13 | 16 | Miami | 1.3 | 13.0 | -1.8 | -5 | 53.36 |
| 14 | 11 | Kansas City | -0.3 | 25.4 | 2.2 | 7 | 52.89 |
| 15 | 14 | Tennessee | 0.4 | 16.2 | -2.1 | -4 | 50.02 |
| 16 | 18 | New Orleans | -0.7 | 14.8 | -3.2 | 0 | 49.52 |
| 17 | 20 | Oakland | -1.6 | 11.7 | 0.8 | 8 | 49.47 |
| 18 | 28 | Cincinnati | 0.4 | 22.3 | -3.1 | 3 | 49.22 |
| 19 | 17 | Washington | -0.1 | 22.3 | -0.4 | -2 | 48.07 |
| 20 | 15 | Baltimore | -0.5 | 14.1 | -0.9 | 2 | 46.73 |
| 21 | 19 | Indianapolis | -0.7 | 18.7 | -0.9 | 1 | 46.24 |
| 22 | 21 | Detroit | -1.0 | 14.2 | 0.0 | 1 | 44.31 |
| 23 | 30 | Tampa Bay | -0.9 | 20.2 | -5.2 | -3 | 41.90 |
| 24 | 24 | NY Giants | 0.5 | 17.0 | -1.1 | -7 | 41.69 |
| 25 | 26 | Los Angeles | -0.1 | 21.7 | -4.9 | -3 | 39.78 |
| 26 | 25 | Carolina | 0.1 | 4.8 | -2.5 | -8 | 39.46 |
| 27 | 22 | Chicago | 0.5 | 9.5 | -8.2 | -2 | 37.62 |
| 28 | 23 | Houston | -1.1 | 11.1 | -5.3 | -6 | 35.66 |
| 29 | 27 | Jacksonville | 0.3 | 25.4 | -7.2 | -7 | 34.50 |
| 30 | 29 | Cleveland | -1.0 | 19.5 | -11.0 | -2 | 21.66 |
| 31 | 32 | NY Jets | -0.5 | 18.2 | -8.7 | -11 | 19.33 |
| 32 | 31 | San Francisco | -2.1 | 13.5 | -10.7 | -2 | 16.28 |
Note that all stats used are per-play stats (yards per attempt, yards per carry against, etc.) for offense, defense and special teams. Points, turnovers, etc. are per-game stats to account for bye weeks.
Next: Seahawks add a tackle... on defense
Strength of schedule is taken from TeamRankings. This strength of schedule adjustment partly explains why this index likes the Bills much more than their off-field play might suggest. Buffalo has played a brutal schedule so far this season.
